Essential Concepts in Gene Prediction and Annotation

After genome assembly (covered in my previous blog) comes the vital step of gene prediction and annotation. This step entails the prediction of all the genes present in the assembled genome and to provide efficient functional annotation to these genes from the data available in diverse public repositories; such as Protein Family (PFAM), SuperFamily, Conserved Domain Database (CDD), TIGRFAM, PROSITE, CATH, SCOP, and other protein domain databases. It is imperative to understand that prediction and annotation of non-protein-coding genes, Untranslated Regions (UTR), and tRNA are as vital as protein-coding genes to determine the overall genetic constitution of the assembled genome.
It is easy to confuse gene prediction with gene annotation, although they are two different steps implemented in giving an identity to the gene under study. Gene annotation is followed by gene prediction. For gene prediction, there are a few robust and efficient prediction algorithms (also known as gene finding and CDS predictors) such as Glimmer (Prokaryotes), GlimmerHMM (Eukaryotes), and GeneMarkS (Prokaryotes, Eukaryotes, and Metagenomes) that are used to identify the coding genes without reporting untranslated regions and splice variants. Aragorn can be used for transfer RNA (tRNA) prediction.
Prokaryotic gene prediction and annotation is noticeably simpler compared to eukaryotic gene prediction and annotation, considering the complexity and the size of the eukaryotic genome and its genetic constitution. For example, bacterial strains generally have no introns, and bacterial transcription start sites and regulatory elements are typically in close proximity with the respective genes. On the other hand, in eukaryotes such as in humans, about 99% of the genome is composed of non-protein-coding DNA. Additionally, the human genome has more variable amounts of repetitive DNA that comprise about 50% of the genome.
Gene annotation is much more complex than gene prediction. Manual curation holds vital significance in the accuracy of the annotations. It involves finding, deducing, and annotating all sorts of functional information on the DNA sequence, so much that some call this process in silico transcriptomics. Genome annotation can be divided into two phases. During the first (computation) phase, the software predicts genes using either ab initio prediction based on DNA sequence patterns or existing evidence such as RNA-seq, ChIP-seq, and proteomics data. During the second (annotation) phase, these data are synthesized into gene annotations. Most gene annotation pipelines are focused on protein-coding genes, but many new tools are now available to predict small RNAs and non-coding RNAs.
It is a common practice to make de novo genome assemblies and their predictions and annotations publicly available in repositories like GenBank. Thus, it is pertinent to validate the accuracy and stringency of the predictions and annotations since bad genome annotations can consequently have a ripple effect. Every incorrect annotation can negatively influence further studies that are based upon the annotations submitted in GenBank. Therefore, it is not only important to experimentally validate annotations from public databases but also to perform stringent quality control of gene annotations.
Genome Annotation
1. Prokaryotic Genome Annotation
A typical genome annotation pipeline for a prokaryote genome goes as follows:
- The gene predictor software scans the assembled genome sequence for regions that are likely to encode proteins or functional RNA. The output of the gene predictors can be saved in Gene File Format (GFF) files.
- The identified genes are then queried in reference databases using tools such as the Basic Local Search Alignment Tool (BLAST) to find related sequences in NCBI, EMBL, and DDBJ repositories. If a related sequence with a high percentage similarity and identity is found, then the information about their function is added to the annotation. These may include structural and chemical properties, predicted operons, gene ontologies, evolutionary relationships, and metabolic pathways.
- In the next important step, comparative sequence analysis and manual curation are used to polish the prediction and annotation results. Before comparative analysis, the assembled genome is BLASTed against the non-redundant nucleotide sequence database of NCBI; and the top 20 to 50 BLAST hits/results (genome sequences) are taken for downstream processing. The genome sequences and their corresponding annotated genes in GFF file format obtained from the BLAST output should be used for comparative analysis. The GFF files can be downloaded from the “Assembly” database of NCBI. The genomes along with their corresponding GFF files can then be uploaded to a genome viewer for manual curation. Once uploaded, the target assembled genome and the BLAST output genome sequences are aligned with each other using a Multiple Sequence Alignment (MSA) algorithm. The main objective of comparative analysis is to find out if the start codon of a predicted gene in the assembled genome matches the start codon of the same gene belonging to the BLAST output genome sequences in the multiple sequence alignment. Additionally, it also helps in refining the predicted gene length. Manual curation is performed on every gene of the assembled genome. Ideally, BLAST hits with high sequence similarity should belong to a closely related bacterial or viral strain of the target genome, and hence, the annotated genes and their start codons must align with the corresponding same gene in the target genome. This very information can be used to update and manually curate, and eventually, provide precision to the predicted genes of the assembled genome.
The manual curation can be done by genome viewers such as Integrative Genome Viewer (IGV), GenomeView, and Geneious. These tools not only provide a comprehensive visualization of the assembled and annotated genome but also possess features for modifying and updating predicted genes and their annotated features. For instance, there could be cases where the predicted coding sequence (CDS) of a gene has a start codon with poor ribosome binding affinity (can be calculated by “Ribosome Binding Calculators”). In such cases, an alternate start codon should be chosen for the CDS using a genome viewer. Geneious is recommended for gene prediction, annotation, and curation because of its vast genome analysis features. Moreover, Geneious provides a sophisticated interface to visualize complex genomic data.
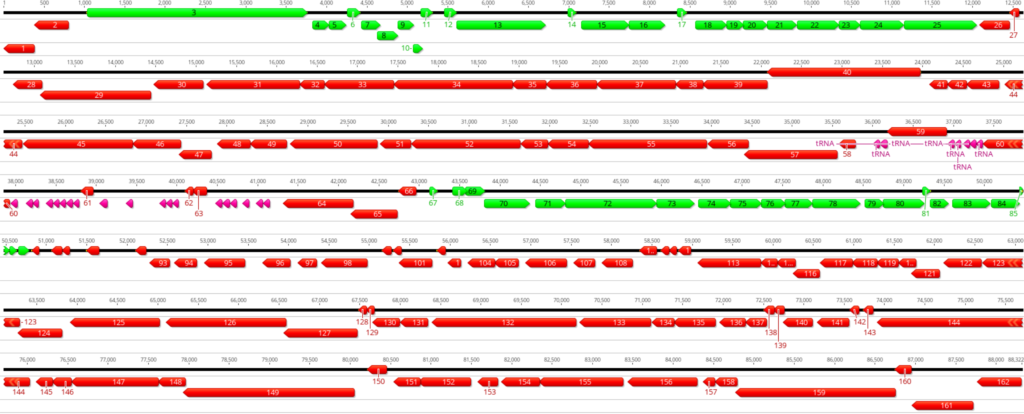
Key Considerations For Manual Curation Of Prokaryotic Genomes
A few key points should be taken into consideration when conducting manual curation of
predicted prokaryotic genes (Figure 1):
- Genes do not overlap by more than a few base pairs; up to 30 – 40 bases is legitimate.
- Gene density is high in the prokaryotic genome and there are no large non-coding gaps between genes.
- If there are two genes transcribed in opposite directions, there has to be a space of at least 50 base pairs between their start sites for transcription promoters in both directions.
- Protein-coding genes are generally at least 120 bases long; however, there are a few exceptions.
- Genes with a size below 200 base pairs should be carefully investigated for annotation.
- Genes are generally found transcribed in one direction, either forward or reverse. Switches in gene orientation (forward to reverse, and vice versa) are rare.
- Protein-coding genes start with either ATG, GTG, or TTG codon. ATG and GTG are generally used at almost equal frequencies, whereas TTG is used rarely at about 7% frequency in the complete genome.
- Protein-coding gene ends with either TAG, TGA, or TAA stop codon.
- Stop codons are fixed and cannot be changed.
By following the above points, genes can be manually curated, and start codons of the predicted genes can be moved to appropriate positions by keeping the alignment with other genes and RBS score into consideration. Next, the updated genes should be re-BLASTed against the non-redundant (nr) protein database to see if any new information can be obtained. Notice that the BLAST performed before manual curation and after manual curation is necessary as the change in gene start sites could significantly change the annotation.
Then comes the functional annotation step. One way to determine gene function is by querying the amino acid sequences obtained from re-BLAST in different conserved protein domain databases. Interproscan is a recommended tool for predicting protein function. The tool performs an extensive conserved protein domain search in various protein family databases such as Protein Family (PFAM), SuperFamily, Conserved Domain Database (CDD), TIGRFAM, PROSITE, CATH, SCOP, and other protein domain repositories.
Although it is recommended to follow a comprehensive approach as stated above for prokaryote genome annotation, there are a few automated pipelines that perform the prediction and annotation with the assembled genome as an input, such as Prokka. These pipelines can be used at your discretion; however, utmost care should be taken during the manual curation step.
The aforementioned steps lead to an efficient gene prediction and annotation for prokaryotes.
2. Eukaryotic Genome Annotation
As eukaryotic genomes are much larger and more complex, the prediction and annotation strategies differ significantly from that of prokaryotes.
The computation phase of the eukaryotic genome annotation can be divided into two stages:
a. Repeat Identification Stage
Repeats are often poorly conserved in the genome and hence are difficult to identify and mask (mask is the process of obscuring the identified repeat regions and denoting them as “N” in the genome such that the sequence alignment and prediction tools do not consider them for downstream processes). To handle the issue, one can create a “repeat library” of the genome of interest by homology-based tools (MITE-hunter, detectMITE) or de novo tools (RepeatScout, Recon, RepeatModeler). The generated repeat library can then be used as an input to RepeatMasker to mask the repeat regions. RepeatMasker uses BLAST to identify the homologs to repeats. Once the repeats are identified, masking is performed.
b. Evidence Alignment Stage
After repeat masking, Expressed Sequenced Tags (ESTs), proteins and RNA-seq sequences from previously identified transcripts and proteins of the organism whose genome is being annotated are aligned to the assembled genome. Protein sequences from other organisms can also be used in the alignment as these retain substantial sequence similarity compared to nucleotide sequences. UniProt/SwissProt database and NCBI taxonomy browser can be used to obtain protein sequences for alignment.
ESTs and protein sequences are aligned to the assembled genome using BLAST to identify homologs. The resulting alignment is then filtered based on the percentage sequence similarity and identity. After filtering, the alignment data is clustered to identify overlapping predictions. “Clustering” serves the purpose to identify data belonging to a single cluster supporting the same gene. Subsequently, “polishing” is performed, in which highly similar sequences identified by BLAST are re-aligned to the target genome to procure approximations on exon-boundaries. Exonerate and Splign tools are widely used for re-alignments.
RNA-seq data hold the greatest potential in improving the accuracy of gene annotations due to its ability to determine exons and splice sites. TopHat can be used to directly align the RNA-seq data to the assembled genome followed by the assembly of alignments (rather than reads) into transcripts using cufflinks. Once the evidence alignment is accomplished, annotation pipelines like Maker can be used for genome annotation with obtained evidence alignments as input.
Ab initio Gene Prediction
In the case that no external evidence is available to identify a gene or to determine its intron-exon structure, “Ab initio gene prediction” can be performed. The tools implementing ab initio predictions use mathematical models rather than external evidence to identify the genes. The disadvantage of the predictors is that they use pre-calculated parameters files comprising organism-specific genomic traits of genomes for gene predictions. To use these predictors the target assembled genome must be very closely related to the reference model chosen for gene predictions. Moreover, considering that the intron and exon length, codon usage, and GC content of closely related organisms could differ, using such predictors could cause significant inaccuracies to the predicted genes. Hence, in principle, to overcome this problem, alignments of ESTs, protein sequences, and RNA-seq data to a genome can be used to train these gene predictors. The Maker pipeline provides a process for training some predictors such as Augustus (accepts expressed sequence tag (EST)-based and protein-based evidence hints.).
Automated Annotation
Next comes the annotation phase, where the data from the computation phase are synthesized into a final set of gene annotations.
Using traditional manual gene annotation on large assemblies is labor-intensive and impractical. Thus, automated annotations are performed in which a set of gene predictors are run over the target genome. From the obtained results, a single prediction that best represents the consensus of the models from the overlapping predictions is selected by a “chooser algorithm”. JIGSAW is one such algorithm. However, like ab initio predictors JIGSAW needs to be re-trained for each new genome. To achieve better predictions, an approach could be to feed the alignment evidence to the gene predictors at run time and then use JIGSAW to identify the most representative prediction. Pipelines like Maker and PASA process the predictions – before or after running the chooser algorithm like JIGSAW to attain greater accuracies by adding Untranslated Region (UTR) information from RNA-seq and EST data.
Quality Control And Assessment Of Annotated Data
Once the annotation is accomplished, the output data from the annotation pipelines can be used for visualization in tools like IGV. To efficiently use the tool, one should upload the assembled genome, sequence reads in FASTQ files, gene annotations, and variant calling files (VCF); and manually curate the identified variants based on their biological significance. The ideal representation of gene annotations should be in GFF format as this format uses controlled vocabularies and ontologies to define genetic descriptive terminologies. It also guarantees interoperability between different analysis tools.
Assessment of annotation quality can be done by qualifying the percentage of annotations that encode proteins with known protein domains using tools such as Interproscan or by tools like Maker. Usually, the domain content of the human and prokaryotic proteomes varies between 57% and 75%. Thus, eukaryotic proteome with a percentage of domains less than the aforementioned is a warning sign of poor annotation. Domain content provides a significant estimate on overall annotation quality; however, it bestows little guidance on judging the accuracy of annotations. Assessment of annotation accuracy can be performed by using the Annotation Edit Distance (AED) metric feature embedded in the MAKER2 genome annotation pipeline. AED measures the congruence of each annotation with its overlapping evidence in the alignment and provides a value between 0 and 1 for annotations to identify problematic annotations that require further manual curation. An AED of 0 indicates that the annotation is in perfect agreement with its evidence, whereas an AED of 1 indicates an absolute lack of evidence support for the annotation.
Apart from improving the accuracy and quality of annotations, one should also pay attention to the erroneous annotations which can be eliminated by editing its intron-exon coordinated manually. Artemis browser is widely used for this purpose.
Submission Of Annotated Data
After following the prior steps in prokaryotic and eukaryotic genome annotation, it is a good practice to make the annotated data publicly available by submitting it to free knowledge databases such as GenBank. GenBank is one of the most comprehensive collections of such annotations. These annotations can provide an essential resource for other genome annotation projects, where the transcripts and proteins from one annotation can be used to annotate other related genomes.
In this article, we have covered the basics and essentials of gene prediction and annotation for both prokaryotes and eukaryotes. Genome annotation in both organisms comprises challenges, which however can be overcome by following the details and concepts elaborated in this article. As the tools and sequencing technologies continue to develop, it is not surprising to see more and more robust options available for performing genome annotations. Moreover, with technological advancement, it becomes imperative to periodically update every genome’s annotation. Incorrect or incomplete annotations if submitted to GenBank can lead to wrong predictions in experiments and computational analyses that make use of them.
To learn more about gene prediction and how NGS can assist you, and to get access to all of our advanced materials including 20 training videos, presentations, workbooks, and private group membership, get on the Expert Sequencing wait list.

ABOUT DEEPAK KUMAR, PHD
GENOMICS SOFTWARE APPLICATION ENGINEER
Deepak Kumar is a Genomics Software Application Engineer (Bioinformatics) at Agilent Technologies. He is the founder of the Expert Sequencing Program (ExSeq) at Cheeky Scientist. The ExSeq program provides a holistic understanding of the Next Generation Sequencing (NGS) field - its intricate concepts, and insights on sequenced data computational analyses. He holds diverse professional experience in Bioinformatics and computational biology and is always keen on formulating computational solutions to biological problems.
More Written by Deepak Kumar, PhD


