5 Considerations For Statistical Analysis Of Flow Cytometry Data

Congratulations, your grant has been funded! Now comes the hard part — performing the work that you are being funded to do. This means generating data and publishing papers. What was that hypothesis again? It must be in the grant somewhere, right?
For the sake of this blog, the grant is to study the effects of Cordilla Virus, which is known to cause lipid membrane flipping on CD8+ T-cells. This flipping results in phosphatidylserine expression on the outer membrane, causing infected cells to be phagocytosed by macrophages. A lead compound, Masiform D, has been identified that shows promise in reducing the viral load of patients infected with Cordilla Virus.
To avoid even the appearance of HARKing — Hypothesizing After The Results Are Known — it is important to start at the beginning of the statistical analysis process even before the first experiments are performed. This process consists of 5 steps:
1. Set the Null Hypothesis
The null hypothesis (H0) is a statement of what we think the state of the system is. In this case, the state of the system after treatment would be that there was no change in the system — i.e. the means between control and experimental are equal.
When performing statistical inference testing, this is the baseline state of our system. We are going to demand a great deal of proof (“beyond a reasonable doubt”) to reject the null hypothesis and accept the alternative hypothesis (HA).
If our data rises to the level of confidence to reject the H0, we are very sure in our HA. If our data does not allow us to reject the H0, it doesn’t mean that the H0 is true, it just means the evidence doesn’t support rejecting it.
When stating the null, it is important to remember that the “equals” sign will be associated with the H0, and not the HA. Additionally, if we are predicting the effect will be in one direction or the other, that is acceptable in the H0.
Going back to our hypothetical grant, we are looking to see if Masiform D reduces the viral load on patients infected with Cordilla Virus. Since we only care if Masiform D decreases viral load in our patients (as opposed to increased or stable load), the H0 and HA could be stated like this:
H0: Viral load (VL) in patients infected with Cordilla Virus and treated with Masiform D (MD) remains the same or is increased compared to patients infected with Cordilla Virus who were not treated with Masiform D (UT) : VLUT ≥ VLMD
HA: Viral load (VL) in patients infected with Cordilla Virus and treated with Masiform D (MD) is decreased compared to patients infected with Cordilla Virus who were not treated with Masiform D (UT) : VLUT < VLMD
Notice 2 important factors about the H0 and HA
- They are mutually exclusive — this means that the H0 and HA do not share anything in common.
- They are collectively exhaustive — this means that all possible outcomes are explained by either the the H0 or the HA.
Having set the stage, it is time to build the other factors that will go into determining whether we accept or reject the H0.
2. Establish a threshold
The threshold (or α) can be thought of as the finish-line. If the analysis of the data crosses this threshold, the H0 is rejected and the HA is accepted.
This threshold is typically set at 0.05, based on convention. However, lowering the threshold to 0.01 or even 0.001 may be more appropriate.
There is no easy guidance for this choice, except that the lower the threshold (higher p-value), the easier it is to find significance, and to commit a type I (false positive) error. The table below is based on this article which categorizes p-values based on the consequences of a false positive.
| p Value assumes a 2-tailed test | Consequences of False Positive |
| 0.01 | Death — think clinical trials |
| 0.05 | No publication — standard for most publications |
| 0.1 | You lose time and money — increased false positives means chasing down more leads, but few other consequences |
| 0.2 | You lose more time and money — increased false positives means chasing down more leads, but few other consequences |
| 0.49 | You are wrong — just a bit better than flipping a coin. |
As the desired p-value decreases, it is valuable to increase the “n” — that is, the number of samples — which can be determined using the Power calculation, which helps provide an estimate of the number of samples needed to be collected.
It is also a measure of the chance of a false negative (𝛃) since Power = 1-𝛃. You can find a power calculator here for free. It’s always a good idea to check with your local biostatistician before you finalize your plan!
3. Performing the experiments
This is the fun part of the process. Make sure to go through the process to design and validate an experiment that is discussed in other parts of the blog, such as: panel design, instrument optimization, and preparing for your first experiment.
In the case of our hypothetical experiment, flow cytometry was chosen to measure the CD8+ cells in our patients, and to determine the amount of phosphatidylserine on the surface of these cells using the Annexin V reagent.
After the experiment is done, the primary analysis will be performed. A guide about gating and primary analysis can be found here. The important point is that the correct numerical data is extracted from the primary analysis, and the gating is done using all the controls necessary to identify the populations of interest.
4. Performing the statistical test
This is where everything comes together. The experiments are complete, and the numerical data has been extracted.
In the case of our hypothetical experiment, CD8+ cells were identified through immunostaining and the amount of Annexin V staining was described by fluorescence intensity.
Since this is a measure of changes in fluorescent intensity, the data is used to calculate the resolution metric, the RD. The RD is: medianpos-medianneg/rSDpos+rSDneg
Thus, the dataset is the list of RD for patients who have been treated versus those who have not been treated. From there, the statistical analysis will be performed.
In this experiment, the statistical test that will be used is the Student’s T-Test. This test relies on the T-distribution, which looks like a normal distribution, but has heavier tails, because of something called the “degrees of freedom”.
Mathematically, the degrees of freedom are measured as the sample size minus 1 (n-1). What does the degrees of freedom really mean?
This is the constraint of the system. For example, if you know 100 values and have the mean, the first 99 can take any value. The 100th value is completely constrained because that value must make the average that has been determined. The same applies for the median. Thus, only n-1 values have freedom.
Back to the T-distribution, the figure below shows the difference between a normal distribution (green), and a distribution with 3 degrees of freedom (blue), and 10 degrees of freedom (red), and the 95% confidence intervals are the vertical lines of the same colors.
As can be seen, the fewer the number of samples, the larger the differences have to be to determine statistical significance. The “rejection region” is the area under the curve to the left and right of the 95% lines. If this was a one-tailed test, then only one of these areas is considered.
Mathematically, there are 2 ways to determine if the data is statistically significant. In either case, we calculate the T statistic, which is defined as:
Based on the threshold (1-CI, or α), it is possible to calculate the Critical Value (CV). The decision rule becomes if T*>CV, we reject the H0, and thus accept the HA. The alternative way to use this is to use T* to calculate the p value. Under this method, if the α>p, we would reject the H0, and thus accept the HA.
It doesn’t matter which method you use, although the second method is a bit easier to understand and easier to compare to the threshold. Both approaches get you to the same answer, but most statistical programs use the p value method.
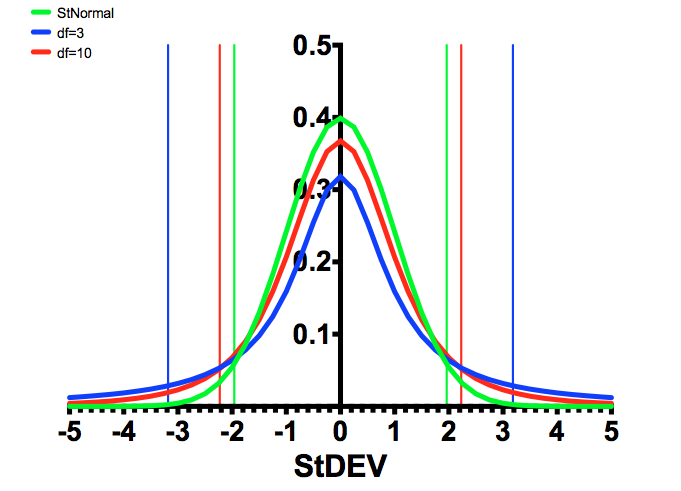
FIGURE 1: Comparison of the T distributions with the Standard Normal Distribution.
5. Stating the results
The last step is to state the conclusion. Based on the results of the statistical analysis, there are 2 options: either the H0 is rejected, or not.
If we reject the H0, that means we accept that we are confident in the HA.
One way to consider the interpretation of the p-value is to say that if a random sample were chosen, what is the probability that it would be at least as extreme as the observed data, under the assumption that the null hypothesis is true?
Thus, it can be interpreted as if the null hypothesis was really true, it would be extremely unlikely to see the kind of data that is being observed.
Does that mean that if we don’t reject the H0, we are equally confident that it is true? The answer is no — all it means is that there is not sufficient evidence to reject the H0, which is very different than saying that you should accept the H0.
Is that all? Does it stop at this point? Historically, this was the end of the analysis and papers with the phrase, “statistically significant” used to describe the data was published and research marched on.
However, over the last few years, the statistical community has been having a debate about the power of the p-value and how to properly interpret this. This article by Regina Nuzzo describes in detail some of the issues around how the p-value is interpreted, suggesting that, “…it is not as reliable as scientists assume.” This has lead the American Statistical Association to develop a statement about the p-value.
There is a role for the p-value in hypothesis testing, however, it is critical that we continue to evaluate the best tools to define statistical significance. These ideas will be the topics of future blog posts, so stay tuned!
To learn more about 5 Considerations For Statistical Analysis Of Flow Cytometry Data, and to get access to all of our advanced materials including 20 training videos, presentations, workbooks, and private group membership, get on the Flow Cytometry Mastery Class wait list.

ABOUT TIM BUSHNELL, PHD
Tim Bushnell holds a PhD in Biology from the Rensselaer Polytechnic Institute. He is a co-founder of—and didactic mind behind—ExCyte, the world’s leading flow cytometry training company, which organization boasts a veritable library of in-the-lab resources on sequencing, microscopy, and related topics in the life sciences.
More Written by Tim Bushnell, PhD


