How To Perform A T-Test

With the ability to capture expression data at the single cell level through many thousands of cells in a short time, flow cytometry data is very numbers rich. The importance of those numbers and how to use them in hypothesis testing is critical to ensure the robustness of the analysis.

After establishing the null hypothesis for the experiment, the type of statistical test, and the numbers necessary will become obvious. For example, if the null hypothesis states that the ‘treatment of B cells with thiotimoline does not change the expression of CD221B in normal patients.’

Based on this null hypothesis:

1. Assuming a gaussian distribution, a T-test will be performed.

2. The median and robust Standard Deviation will need to be known for the untreated and treated samples.

3. Additionally, the threshold needs to be establish. In this experiment the threshold is set to 0.01.

Here is the data:

Numbers Chart 1

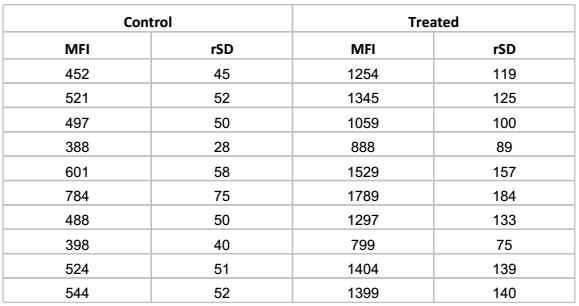
Using a statistical tool, such as Graphpad Prism, the T-Test can be performed. Based on that result, the P value is less than 0.0001, which is below our threshold. Therefore the data is significant.

There are some limitations with directly comparing the median fluorescent intensities, especially in the case of a multi-center study with different instrumentation and such. In that case, the conversion of the data to a resolution metric, such as the RD is recommended. In this case, a one-sample T-Test can be performed on the data.

The RD is defined as follows:

RD = (MedianA-MedianB)/(rSDA+rSDB)

If the above data were to be converted, A would be defined as the treated sample and B as the control sample. That would result in the following data:

Numbers Chart 2

A one-sample T-test allows the comparison of a single sample to be compared to a known population mean. In this case, the mean would be 0. This is because the assumption is that the treatment causes no effect, so MedianA-MedianB would be 0.

Running the T-test, the results show, as expected, that this data is statistically significant.

The advantage of the RD is that issues with the experimental system (labeling, cell number etc), and the instrument can be smoothed out – making comparisons easier to interpret and understand.

This is a simple case of the power of statistics in flow cytometry. Please join me for an upcoming lecture where this and other topics such as statistical errors (and how to avoid them), ANOVA and linear regression will be discussed.

Join Expert Cytometry's Mastery Class

ABOUT TIM BUSHNELL, PHD

Tim Bushnell holds a PhD in Biology from the Rensselaer Polytechnic Institute. He is a co-founder of—and didactic mind behind—ExCyte, the world’s leading flow cytometry training company, which organization boasts a veritable library of in-the-lab resources on sequencing, microscopy, and related topics in the life sciences.

Tim Bushnell, PhD

Similar Articles

Common Numbers-Based Questions I Get As A Flow Cytometry Core Manager And How To Answer Them

Common Numbers-Based Questions I Get As A Flow Cytometry Core Manager And How To Answer Them

By: Tim Bushnell, PhD

Numbers are all around us.  My personal favorite is ≅1.618 aka ɸ aka ‘the golden ratio’.  It’s found throughout history, where it has influenced architects and artists. We see it in nature, in plants, and it is used in movies to frame shots. It can be approximated by the Fibonacci sequence (another math favorite of mine). However, I have not worked out how to apply this to flow cytometry.  That doesn’t mean numbers aren’t important in flow cytometry. They are central to everything we do, and in this blog, I’m going to flit around numbers-based questions that I have received…

How To Do Variant Calling From RNASeq NGS Data

How To Do Variant Calling From RNASeq NGS Data

By: Deepak Kumar, PhD

Developing variant calling and analysis pipelines for NGS sequenced data have become a norm in clinical labs. These pipelines include a strategic integration of several tools and techniques to identify molecular and structural variants. That eventually helps in the apt variant annotation and interpretation. This blog will delve into the concepts and intricacies of developing a “variant calling” pipeline using GATK. “Variant calling” can also be performed using tools other than GATK, such as FREEBAYES and SAMTOOLS.  In this blog, I will walk you through variant calling methods on Illumina germline RNASeq data. In the steps, wherever required, I will…

Understanding Clinical Trials And Drug Development As A Research Scientist

Understanding Clinical Trials And Drug Development As A Research Scientist

By: Deepak Kumar, PhD

Clinical trials are studies designed to test the novel methods of diagnosing and treating health conditions – by observing the outcomes of human subjects under experimental conditions.  These are interventional studies that are performed under stringent clinical laboratory settings. Contrariwise, non-interventional studies are performed outside the clinical trial settings that provide researchers an opportunity to monitor the effect of drugs in real-life situations. Non-interventional trials are also termed observational studies as they include post-marketing surveillance studies (PMS) and post-authorization safety studies (PASS). Clinical trials are preferred for testing newly developed drugs since interventional studies are conducted in a highly monitored…

How To Profile DNA And RNA Expression Using Next Generation Sequencing (Part-2)

How To Profile DNA And RNA Expression Using Next Generation Sequencing (Part-2)

By: Deepak Kumar, PhD

In the first blog of this series, we explored the power of sequencing the genome at various levels. We also dealt with how the characterization of the RNA expression levels helps us to understand the changes at the genome level. These changes impact the downstream expression of the target genes. In this blog, we will explore how NGS sequencing can help us comprehend DNA modification that affect the expression pattern of the given genes (epigenetic profiling) as well as characterizing the DNA-protein interactions that allow for the identification of genes that may be regulated by a given protein.  DNA Methylation Profiling…

How To Profile DNA And RNA Expression Using Next Generation Sequencing

How To Profile DNA And RNA Expression Using Next Generation Sequencing

By: Deepak Kumar, PhD

Why is Next Generation Sequencing so powerful to explore and answer both clinical and research questions. With the ability to sequence whole genomes, identifying novel changes between individuals, to exploring what RNA sequences are being expressed, or to examine DNA modifications and protein-DNA interactions occurring that can help researchers better understand the complex regulation of transcription. This, in turn, allows them to characterize changes during different disease states, which can suggest a way to treat said disease.  Over the next two blogs, I will highlight these different methods along with illustrating how these can help clinical diagnostics as well as…

What Is Next Generation Sequencing (NGS) And How Is It Used In Drug Development

What Is Next Generation Sequencing (NGS) And How Is It Used In Drug Development

By: Deepak Kumar, PhD

NGS methodologies have been used to produce high-throughput sequence data. These data with appropriate computational analyses facilitate variant identification and prove to be extremely valuable in pharmaceutical industries and clinical practice for developing drug molecules inhibiting disease progression. Thus, by providing a comprehensive profile of an individual’s variome — particularly that of clinical relevance consisting of pathogenic variants — NGS helps in determining new disease genes. The information thus obtained on genetic variations and the target disease genes can be used by the Pharma companies to develop drugs impeding these variants and their disease-causing effect. However simple this may allude…

7 Key Image Analysis Terms For New Microscopist

7 Key Image Analysis Terms For New Microscopist

By: Heather Brown-Harding, PhD

As scientists, we need to perform image analysis after we’ve acquired images in the microscope, otherwise, we have just a pretty picture and not data. The vocabulary for image processing and analysis can be a little intimidating to those new to the field. Therefore, in this blog, I’m going to break down 7 terms that are key when post-processing of images. 1. RGB Image Images acquired during microscopy can be grouped into two main categories. Either monochrome (that can be multichannel) or “RGB.” RGB stands for red, green, blue – the primary colors of light. The cameras in our phones…

We Tested 5 Major Flow Cytometry SPADE Programs for Speed - Here Are The Results

We Tested 5 Major Flow Cytometry SPADE Programs for Speed - Here Are The Results

By: Tim Bushnell, PhD

In the flow cytometry community, SPADE (Spanning-tree Progression Analysis of Density-normalized Events) is a favored algorithm for dealing with highly multidimensional or otherwise complex datasets. Like tSNE, SPADE extracts information across events in your data unsupervised and presents the result in a unique visual format. Given the growing popularity of this kind of algorithm for dealing with complex datasets, we decided to test the SPADE algorithm in 5 software packages, including Cytobank, FCS Express, FlowJo, R, and the original, free software made available by the author of SPADE. Which was the fastest?

5 FlowJo Hacks To Boost The Quality Of Your Flow Cytometry Analysis

5 FlowJo Hacks To Boost The Quality Of Your Flow Cytometry Analysis

By: Tim Bushnell, PhD

FlowJo is a powerful tool for performing and analyzing flow cytometry experiments, if you know how to use it to the fullest. This includes understanding embedding and using keywords, the FlowJo compensation wizard, spillover spreading matrix, FlowJo and R, and creating tables in FlowJo. Extending your use of FJ using these hacks will help organize your data, improve analysis and make your exported data easier to understand and explain to others. Take a few moments and explore all you can do with FJ beyond just gating populations.

Top Industry Career eBooks

Get the Advanced Microscopy eBook

Get the Advanced Microscopy eBook

Heather Brown-Harding, PhD

Learn the best practices and advanced techniques across the diverse fields of microscopy, including instrumentation, experimental setup, image analysis, figure preparation, and more.

Get The Free Modern Flow Cytometry eBook

Get The Free Modern Flow Cytometry eBook

Tim Bushnell, PhD

Learn the best practices of flow cytometry experimentation, data analysis, figure preparation, antibody panel design, instrumentation and more.

Get The Free 4-10 Compensation eBook

Get The Free 4-10 Compensation eBook

Tim Bushnell, PhD

Advanced 4-10 Color Compensation, Learn strategies for designing advanced antibody compensation panels and how to use your compensation matrix to analyze your experimental data.