How To Optimize Instrument Voltage For Flow Cytometry Experiments (Part 3 Of 6)

As we continue to explore the steps involved in optimizing a flow cytometry experiment, we turn our attention to the detectors and optimizing sensitivity: instrument voltage optimization. 

This is important as we want to ensure that we can make as sensitive a measurement as possible. 

This requires us to know the optimal sensitivity of our instrument, and how our stained cells are resolved based on that voltage. 

Let’s start by asking the question what makes a good voltage

Joe Trotter, from the BD Biosciences Advanced Technology Group, once suggested the following: 

Electronic noise effects resolution sensitivity  

  • A good minimal PMT voltage would place the unstained cells where the electronic noise is no more than 10% to 20% of the variance. 

Dynamic Range Of The PMT  

  • Leave room for an ~2 fold increase in the expression levels of the makers
  • Ensure the cells are within the linear range of the detector
  • Are the negatives (in the stained cells) too high?
  • Ensure that the compensation controls are within the linear range of the detector? 

You can see all these conditions met in the best settings. 

Now that we have defined a good voltage, the question is how do we determine that voltage?  

There are several paths that will get to that point. The first step for voltage optimization is determining the sensitivity of our detectors. The first method will be the instrument vendor’s recommendation for instrument voltage optimization. In some cases, this is the only method. The vendor identifies the best voltage and locks that down so the user cannot adjust the voltage.  

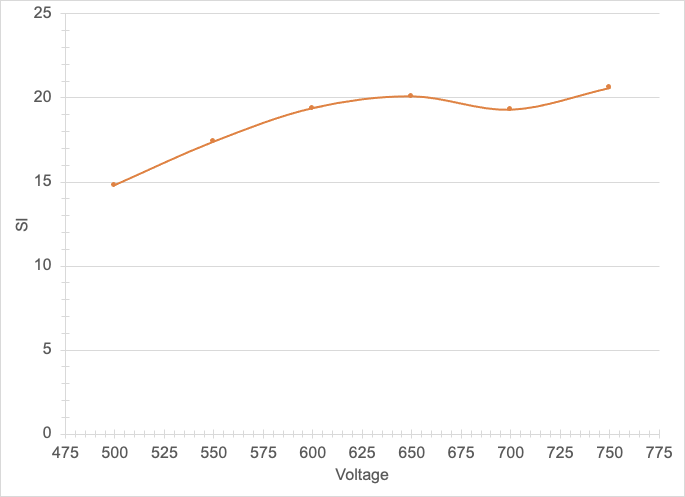
The second method for voltage optimization is to use a particle to identify where the detector is most sensitive. In PMT based systems, this has been popularized by using the 2nd peak of the 8 peak headset from Spherotech, as published in this paper by Maecker and Trotter (2006). Briefly you run these beads over a voltage range. Then calculate the rCV at each voltage and plot voltage vs rCV to generate a curve as shown in Figure 1.  

instrument voltage
Figure 1: Example of peak 2 characterization

Looking at this curve, we can identify a few important points. First, as the voltage increases the CV decreases until it gets to an inflection point. The slope of the line changes here. Beyond this point, the curve becomes flat and there is no improvement in the rCV. Thus, this value at the inflection point is the lowest minimum value that you should use.  

When you are start an experiment, this is the value that you should use. However, beads are not cells. They may not adequately represent the fluorochrome that is on your cells of interest. Especially true with many of the recently released fluorochromes.

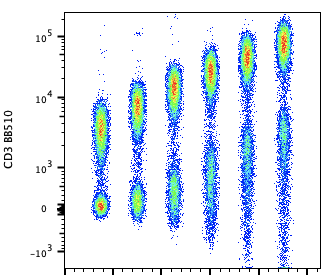
Thus it is good to perform a voltage walk (a ‘voltration’). As you can determine if the sensitivity of the fluorochrome can be improved. In this case, one takes stained cells (stained based on titrated Ab concentration) and performs a similar voltage walk.  

voltage optimization
Figure 2: Voltage optimization for Brilliant Blue 510. Top panel shows concatenated files from 500 volts to 750 volts. As can be seen, as voltage increases, the spread of the background increases dramatically. Bottom panel shows the Staining Index (SI) plotted vs voltage. Based on this curve, the best SI is at 600 volts. While the SI at 650 is slightly higher, the top panel shows the increased spread of the data at that voltage, which could impact dim markers. 

Altogether, once you determine the PMT voltage for your experiment, set up a method to measure that over time. More on that in a future blog.  

Concluding Remarks

As one begins the process of optimization of a polychromatic flow panel, the systematic approach of determining the best antibody concentration (or other fluorescent markers), followed by characterization of the optimal voltage range for the specific fluorochrome in your panel start to provide a you with the data necessary to explain your decisions.

If you will be running this panel over time, it is worth the extra effort to ensure that your panel will be successful and that you will be able to answer the question you are interested in. 

To learn more about important control measures for your flow cytometry lab, and to get access to all of our advanced materials including 20 training videos, presentations, workbooks, and private group membership, get on the Flow Cytometry Mastery Class wait list.

Join Expert Cytometry's Mastery Class

ABOUT TIM BUSHNELL, PHD

Tim Bushnell holds a PhD in Biology from the Rensselaer Polytechnic Institute. He is a co-founder of—and didactic mind behind—ExCyte, the world’s leading flow cytometry training company, which organization boasts a veritable library of in-the-lab resources on sequencing, microscopy, and related topics in the life sciences.

Tim Bushnell, PhD

Similar Articles

The Power Of Spectral Viewers And Their Use In Full Spectrum Flow Cytometry

The Power Of Spectral Viewers And Their Use In Full Spectrum Flow Cytometry

By: Tim Bushnell, PhD

What photon from yonder fluorochrome breaks?  It is … umm… hmmm. Let me see. Excitation off a 561 nm laser, with an emission maximum of 692 nm. I’m sure if Shakespeare was a flow cytometrist, he might have written that very scene. But the play is lost in time. However, since the protagonist had difficulty determining what fluorochrome was emitting photons, let’s consider how this could be figured out. In my opinion, one of the handiest flow cytometry tools is the spectral viewer. This tool helps visualize the excitation and emission profile of different fluorochromes, as well as allowing you…

Fickle Markers: Solutions For Antibody Binding Specificity Challenges

Fickle Markers: Solutions For Antibody Binding Specificity Challenges

By: Tim Bushnell, PhD

Reproducibility has been an ongoing, and important, concept in the sciences for years.  In the area of biomedical research, the alarm was sounded by several papers published in the early 2010’s.  Authors like Begley and Ellis, Prinz and coworkers, and Vasilevsky and colleagues, among others reported an alarming trend in the reproducibility of pre-clinical data.  These reports indicated between 50% to almost 90% of published pre-clinical data were not reproducible.  This was further highlighted in the article by Freedman and coworkers, who tried to identify and quantify the different sources of error that could be causing this crisis.  Figure 1,…

5 Common Flow Cytometry Questions, Answered

5 Common Flow Cytometry Questions, Answered

By: Tim Bushnell, PhD

I want to thank all of you who send us your questions about flow cytometry, so I thought I would dip into the old email bag and answer a few of the common ones here.  If your question isn’t answered this time, look for it to be answered in a future blog post.  Of course, if you want us to cover a specific topic, drop us a line.  1. How Fast Can I Go? This is  a common question. The allure of the ‘hi’ button is hard to resist.  The faster you go, the sooner you are finished with data…

Combining Flow Cytometry With Plant Science, Microorganisms, And The Environment

Combining Flow Cytometry With Plant Science, Microorganisms, And The Environment

By: Tim Bushnell, PhD

My first introduction to flow cytometry was talking to a professor who’d brought one on a research cruise to study phytoplankton. It was only later that I was introduced to the marvelous world that’s been my career for over 20 years.   In that time, I’ve had the opportunity to work with researchers in many different areas, exposing me to a wide variety of cell types and more important assays. What continues to amaze me is the number of different parameters we can measure, not just the number of fluorochromes, but the information we can extract from samples – animal, vegetable…

Common Numbers-Based Questions I Get As A Flow Cytometry Core Manager And How To Answer Them

Common Numbers-Based Questions I Get As A Flow Cytometry Core Manager And How To Answer Them

By: Tim Bushnell, PhD

Numbers are all around us.  My personal favorite is ≅1.618 aka ɸ aka ‘the golden ratio’.  It’s found throughout history, where it has influenced architects and artists. We see it in nature, in plants, and it is used in movies to frame shots. It can be approximated by the Fibonacci sequence (another math favorite of mine). However, I have not worked out how to apply this to flow cytometry.  That doesn’t mean numbers aren’t important in flow cytometry. They are central to everything we do, and in this blog, I’m going to flit around numbers-based questions that I have received…

3 Must-Have High-Dimensional Flow Cytometry Controls

3 Must-Have High-Dimensional Flow Cytometry Controls

By: Tim Bushnell, PhD

Developments such as the recent upgrade to the Cytobank analysis platform and the creation of new packages such as Immunocluster are reducing the computational expertise needed to work with high-dimensional flow cytometry datasets. Whether you are a researcher in academia, industry, or government, you may want to take advantage of the reduced barrier to entry to apply high-dimensional flow cytometry in your work. However, you’ll need the right experimental design to access the new transformative insights available through these approaches and avoid wasting the considerable time and money required for performing them. As with all experiments, a good design begins…

The Fluorochrome Less Excited: How To Build A Flow Cytometry Antibody Panel

The Fluorochrome Less Excited: How To Build A Flow Cytometry Antibody Panel

By: Tim Bushnell, PhD

Fluorochrome, antibodies and detectors are important. The journey of a thousand cells starts with a good fluorescent panel. The polychromatic panel is the combination of antibodies and fluorochromes. These will be used during the experiment to answer the biological question of interest. When you only need a few targets, the creation of the panel is relatively straightforward. It’s only when you start to get into more complex panels with multiple fluorochromes that overlap in excitation and emission gets more interesting.  FLUOROCHROMES Both full spectrum and traditional fluorescent flow cytometry rely on measuring the emission of the fluorochromes that are attached…

Flow Cytometry Year in Review: Key Changes To Know

Flow Cytometry Year in Review: Key Changes To Know

By: Meerambika Mishra

Here we are, at the end of an eventful year 2021. But with the promise of a new year 2022 to come. It has been a long year, filled with ups and downs. It is always good to reflect on the past year as we move to the future.  In Memoriam Sir Isaac Newton wrote “If I have seen further, it is by standing upon the shoulders of giants.” In the past year, we have lost some giants of our field including Zbigniew Darzynkiwicz, who contributed much in the areas of cell cycle analysis and apoptosis. Howard Shapiro, known for…

What Star Trek Taught Me About Flow Cytometry

What Star Trek Taught Me About Flow Cytometry

By: Tim Bushnell, PhD

It is no secret that I am a very big fan of the Star Trek franchise. There are many good episodes and lessons explored in the 813+ episodes, 12 movies (and counting). Don’t worry, this blog is not going to review all 813, or even 5 of them. Instead, some of the lessons I have taken away from the show that have applicability to science and flow cytometry.  “Darmok and Jalad at Tanagra.”  (ST:TNG season 5, episode 2) This is probably one of my favorite episodes, which involves Picard and an alien trying to establish a common ground and learn…

Top Industry Career eBooks

Get the Advanced Microscopy eBook

Get the Advanced Microscopy eBook

Heather Brown-Harding, PhD

Learn the best practices and advanced techniques across the diverse fields of microscopy, including instrumentation, experimental setup, image analysis, figure preparation, and more.

Get The Free Modern Flow Cytometry eBook

Get The Free Modern Flow Cytometry eBook

Tim Bushnell, PhD

Learn the best practices of flow cytometry experimentation, data analysis, figure preparation, antibody panel design, instrumentation and more.

Get The Free 4-10 Compensation eBook

Get The Free 4-10 Compensation eBook

Tim Bushnell, PhD

Advanced 4-10 Color Compensation, Learn strategies for designing advanced antibody compensation panels and how to use your compensation matrix to analyze your experimental data.