Brightness Is In The Eye Of The Detector – What To Consider When Designing Your Panel

The heart and soul of the flow cytometry experiment is the ‘panel.’ The unique combinations of antibodies, antigens, fluorochromes, and other reagents are central to identifying the cells of interest and extracting the data necessary to answer the question at hand. Designing the right panel for flow cytometry is essential for detecting different modalities. The more parameters that can be interrogated will yield more information about the target cells.
Current instruments can measure as many as 40 different parameters simultaneously. This is exciting, as it allows for more complex questions to be studied. Panel design is also valuable for precious samples, as it allows researchers to extract every drop of data out of these samples.
For the last 10 years or so, the journal Cytometry Part A has published a special article type called the Optimized Multicolor Immunofluorescence Panel or the OMIP. These articles have proved helpful for the researchers as they can use these published panels to jumpstart their own research initiatives. However, if there is not an OMIP you can use to answer a specific question, how do you go about designing the panel for flow cytometry detection modalities from scratch?
We need to consider the type of detection system while designing the panel for flow cytometry detection modalities.
Most researchers have access only to traditional fluorescent flow (TFF) instruments. Some may have access to a spectral cytometer (SC) and others to the mass cytometer (MC). Designing a panel for each of these instruments will involve a similar path but with unique twists specific to the way the instrument measures readout. TFF typically has one detector for each fluorochrome, while SC involves measuring the complete fluorochrome spectrum. MC, on the other hand, requires metal tagged antibodies, the mass of which is measured by the time of flight mass spectrometry. The first step in designing the panel for flow cytometry is to determine the appropriate targets that are to be measured.
The first step in any panel design is to determine the appropriate targets that are to be measured. It is imperative to determine which are the cells of interest and the cell surface markers they express. There are different cell surface marker charts for both human and murine models that can be consulted including this one or this handbook of CD markers. The OMIPs and primary literature are just as critical.
Once you know what specific targets need to be interrogated it is important to know which specific antibody clone you should use Different clones can have different effects on the cell, they may have different binding affinities and several other conflicting characteristics. Unfortunately, the primary literature doesn’t always identify the specific clone that was used in an experiment, but there is a tool that can help you with this. There are many websites available that can provide different information about specific clones, vendors, and more. One of my go-to sites is Benchsci.com which uses an AI-based approach to identify, sort, and curate specific reagents, and the technique they were used in. These data are linked back to the primary literature, and the user can review the figures where the data came from. Antibody Registry is a very useful resource for this.
With this list in hand, it is time to take a break to generate a theoretical gating strategy to identify your cells of interest. Even if you are planning to run some clustering algorithm to cluster your data, this is a useful step. A typical sketch is shown below.

The antigens are divided into 3 classes – primary, secondary, and tertiary. Primary targets are highly expressed on the cell surface, think of the major cellular subsets — CD3, CD4, CD19, etc. They generally are either on or off. Secondary targets are those that may have a continuum of expression, may be expressed on multiple cell types, or at different stages of cell differentiation or activation state. Consider these the fine focus in your assay, as they will help identify the specific target cells. The tertiary targets are the ones we are interested in learning more about because the data to answer the question of interest lie there.
Another crucial point to consider is the antigen density on the cells. We use antigen density as a way to determine fluorochrome or metal to use for the target. Historically, we would classify these into low, medium, or high. However, two recent publications have provided more information to answer the density question. The first study by Kalina et al. (2019), used fluorescence to measure the first 100 CD antigens on different immune subsets. The second study, by Amir and coworkers (2019), used mass cytometry to characterize 350 antibodies. These resources are valuable in answering the antigen density question.
The second consideration is the reporter (fluorescence or metal) intensity. For ranking fluorochrome brightness, one can consult tables such as this one from BioLegend, or this one from BD Bioscience. Although these tables provide valuable information about fluorochrome brightness, it is always recommended to create one specifically for your instrument. The laser power and filter configuration can have a significant impact on the sensitivity of the fluorochrome brightness measure. There are various kits out there now that contain 20+ antibodies labeled with different fluorochromes, so it’s pretty easy to do.
In the case of MC, Fluidigm provides this chart for the sensitivity of different metals.

As you can see from this figure, the most sensitive metals are in the middle of the chart, between about 150 and 180 mass units.
Why is this intensity important? While considering pairing antigens with fluorochrome or metal, antigens with low expression should be paired with the brighter or most sensitive reporter, while highly expressed antigens are to be paired with less sensitive or bright reporters.
But that’s not all, and this is where the path between MC, TFF, and SC diverge. In TFF, in addition to the fluorochrome brightness, we need to consider where to make a sensitive measurement.
This concept was described in a paper by Nguyen and coworkers (2013). This metric indicates which detectors receive more spillover based on the fluorochromes chosen. Typical results are shown below. Combinations of detector and fluorochrome that are in yellow should be used with caution, while those in red are bad combinations and you should be careful when using these fluorochromes.

An SSM matrix can also be calculated for SC and help with panel design.
A similar idea for MC is shown in figure 4.

This figure; taken from the ‘Guidelines for Mass Cytometry Panel Design’ highlights where a given metal may cause issues due to isotope impurity and oxidation. These are pretty predictable, so it is relatively easy to correct these issues. As stated in the Guidelines:
“Crosstalk into unused channels is indicated in grey italic font with a white background. Mass tags are color-coded to indicate probes that contribute ≥ 0.5% crosstalk into no channels (green), one or two channels (yellow), or more than two channels (orange). Mass channel labels are color-coded to indicate channels that receive ≥ 0.5% crosstalk from no probes (green), one or two probes (yellow), or more than two probes (orange).”
In the case of SC, particularly the Aurora from CytekⓇ, it is possible to look at the similarity index. In selecting the fluorochromes for your panel, this will report how similar the spectrum of two fluorochromes is to each other. The higher the number, the more similar the spectrum, and it might be worth reconsidering using those two dyes in the same panel. A second value, the complexity index sums these up. The lower this number, the easier it is to work with the dyes, as the spread will be lower. An example of this is shown in figure 5.

A consideration for panel design is the idea of co-expression. Looking back at figure 1, it is possible to see that there are several antigens that are co-expressed on the same cell (for example there is an A+B+C+D- and A+B+C-D+) population of interest. Co-expressed markers can impact the sensitivity of the measurement, based on the choice of fluorochrome. This has been termed the Resolution Impact Matrix. A great example of this can be found in this poster. To calculate this metric, we calculate the Staining Index (SI) for the single population and the Double Positive Staining Index (DPSI) for the coexpressed population. The formula to determine the RIM is [1-(DPSI/SI)]*100, as shown in the figure below from BD Bioscience.

Combining all the pairwise combinations, you can generate a table as shown in figure 7, from BD Bioscience.
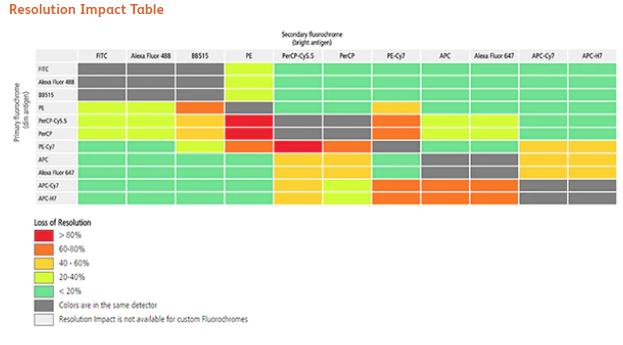
Using this table makes it possible to choose for co-expressed markers to minimize the loss of resolution.
When designing the panel for flow cytometry detection modalities, regardless of your instrument, there are some common steps to take such as determining which antigens to use and pairing those antigens based on their importance and the expression pattern. The second consideration is the loss of sensitivity that has different approaches. The SSM is useful for fluorescent-based measurements, while for the MC, there is less concern as the loss of sensitivity is very predictable, and generally less than 4%.
Of course, don’t forget the other important factors in a panel, such as cell viability dye, which is critical for minimizing the impact of dead cells on the spread of your data. A dump channel is also a useful tool, which will help remove unwanted cells.
At the end of the day, the goal of the panel is to help us identify the cells of interest so that we can characterize these cells based on whatever perturbation we apply to the system. This could be simply counting the cells of interest or looking at the expression level of different interesting proteins. This is the ultimate data from the experiment and goes into our statistical analysis, but that is another blog for another day.
To learn more about important control measures for your flow cytometry lab, and to get access to all of our advanced materials including 20 training videos, presentations, workbooks, and private group membership, get on the Flow Cytometry Mastery Class wait list.

ABOUT TIM BUSHNELL, PHD
Tim Bushnell holds a PhD in Biology from the Rensselaer Polytechnic Institute. He is a co-founder of—and didactic mind behind—ExCyte, the world’s leading flow cytometry training company, which organization boasts a veritable library of in-the-lab resources on sequencing, microscopy, and related topics in the life sciences.
More Written by Tim Bushnell, PhD


