Mass Cytometry Revolves Around These 5 Things

Today’s article will summarize the functionality of mass cytometry technology. This tech has been commercialized largely by Fluidigm in the CyTof systems. There are 5 key points to cover, or takeaways, that cytometrists should keep in mind as they perform their research.
1. How it mass cytometry works
2. Panel design
3. Sample preparation
4. Data analysis
5. Imaging mass cytometry
How Does Mass Cytometry Work?
Traditional fluorescent flow cytometry has started to push the limit of the number of simultaneous parameters that can be measured. With the recent advent of spectral cytometry, as many as 40 simultaneous fluorescence parameters can be measured.
The first foray into high-dimensional cytometry didn’t use fluorescence. Rather, the antibodies were labeled with metal ions. To measure these labels, the cells had to be vaporized and the ion masses measured using a different detector. Thus cytometry time-of-flight, or CyTOF, more commonly known as Mass Cytometry, was born.

Figure 1: The CyTOF process, from Bendall et al. (2012).
The mass cytometry process is shown in figure 1. Cells are labeled following standard procedures, and are introduced into the system by the formation of mist droplets (nebulizer), these droplets pass through the ICP – an induced coupled plasma that vaporizes the cells, leaving the ion cloud. This cloud passes through a quadrupole that is designed to filter out the common/abundant ions leaving the heavy metal ions that were coupled to the antibodies. These are passed into the Time-of-Flight chamber where the mass and quantity of these masses is captured. Thee values are converted into typical FCS data for analysis.
Designing the Panel
A lot has been made about the fact that in mass cytometry there is no ‘compensation’ required. This is because there is no equivalent to autofluorescence of cells in the mass cytometry world. On the other hand, there are several factors including the purity of the metal ion, the oxidation of some metals and the sensitivity of the detector that need to be considered during panel design Figure 2 shows the differential sensitivity of the detector based on mass and figure 3 shows the predicted issues with oxidation and purity.

Figure 2: Differential sensitivity of the CyTOF based on mass.
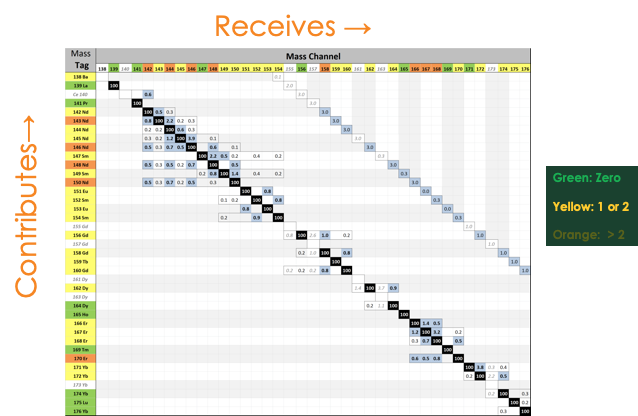
Figure 3: The potential oxidation and purity issues of different metals contributing and receiving error from other metals.
It should be noted that if a patient that a sample is derived from has been exposed to barium (used in some imaging tests), this can impact the instrument sensitivity. Likewise cisplatin, a common chemotherapeutic can also reduce instrument sensitivity. In fact, cisplatin has become a useful viability indicator for mass cytometry experiments.
There is a useful panel design tool that helps take these factors into account. After adding the target populations, you can run an optimized metals and a table, such as shown in figure 4 is generated, making the best recommendations for the proposed panel, taking into account the factors mentioned above.

Figure 4: Output from the CyTOF panel design tool.
Preparing the Sample
Sample preparation, although similar to traditional fluorescent flow, requires that the sample be extremely clean. Unlike fluorescence, where the emitted photons are measured by the detector, in mass spectrometry, all the ions that make it into the TOF will interact with the detector, leading to signal, this is shown in Figure 5. Additionally, with the cells being vaporized the size and complexity parameters that are typically used in fluorescent flow are lost.

Figure 5: The impact of a poorly washed CyTOF sample, showing that the excess contaminates impact the signal. Data from Fluidigm (formerly DVS sciences)
There are some very specific considerations that need to be taken into account since the samples also are finally resuspended in water, rather than a protein containing buffer. Care must be taken when pelleting cells, so make sure to mark where the pellet should be located to reduce the chance of losing the pellet. Second, before running on the instrument, cells are stained with DNA intercalator IR191/IR193 which is used to help identify the target cells
Cell concentration is also important, so that there is clean separation between the ion clouds from each cell, the system should be run at no more than approximately 1,000 events per second. Practically, less than this maximum is better, to take into account uneven delivery of the sample through the nebulizer. If the cells are run to fast, this will lead to cloud fusion, and the resulting data will be suspect. Figure 6 shows this effect.

Figure 6: impact on the data of running cells to fast. The bottom left panel shows the output of the ‘raindrop plot’ when cells are run close together. For comparison, on the bottom right panel, is an example of good cell concentration, with a single cell highlighted in the red box.
Barcoding is a powerful tool for mass cytometry assays. In this process, each individual sample is labeled with a combination of one or more barcoding metal tags, giving each sample a unique signature. The samples are mixed together and antibody staining continues. This ensures all the samples are stained equivalently, reducing the effect of staining individual tubes can have on signal variation, as well as reducing the total amount of antibody needed. This was discussed in this article by Zunder et al (2015), and shown in Figure 7 from that paper.

Figure 7: Barcoding for CyTOF samples.
Finally, CyTOF data lends itself to normalization between runs. This is accomplished using a collection of beads with known intensity of five metals. From those signals, using software the cell data can be corrected. This is described in this paper by Finck et al (2013), and an example of data from figure 2 of that paper is shown below (Fig. 8)

Figure 8: Normalization of CyTOF data using beads. From Finck et al (2013).
Data Analysis
Data analysis of high-dimensional data continues to evolve. While traditional bivariate gating can be performed, automated tools for visualization, clustering and comparing are being developed. These packages can be found as freeware as R scripts, and are getting implemented into commercially available software. The power of each of these tools is such that they require separate articles, so stay tuned to the Expert Cytometry blog for more information. Data analysis from a clustering program (SPADE) and data reduction (tSNE) analysis are shown in figure 9.

Figure 9: Data analysis of CyTOF data via clustering (left panel) and data reduction (right panel)
Researchers are developing pipelines such that data will effectively go in one end and undergo a normalization, a data reduction, a dimensionality reduction, and a gating partition – all of this automatically. This technology has the potential to profoundly facilitate the analysis process.
Imaging Mass Cytometry
CyTOF analysis has been expanded into imaging mass cytometry. In this process, shown in figure 10, a tissue section is labeled with metal-tagged antibodies, the tissue is interrogated with a laser to ionize a part of the sample. The vaporized tissue is carried away and enters the mass cytometer. This process is shown in figure 10, from the paper by Chang and colleagues (2017).

Figure 10: Imaging Mass Cytometry process.
This methodology provides expression level data in a location specific manner, allowing for better understanding and interrogation of complex microenvironments. While an emerging technology, it is rapidly becoming more popular. There are over 20 publications using this technology, including this one from Carvajal-Hausdorf and coworkers (2019), where the authors used an 18-plex analysis of breast cancer patient samples to examine cytotoxic T-cell infiltration after treatment (example data in figure 11).

Figure 11: Results of tissue mass cytometry: From Carvajal-Hausdorf and coworkers (2019)
In conclusion, mass cytometry is a powerful and expanding tool for the complex analysis of both suspension cells and tissues. The ability to measure over 30 targets at the same time allows researchers to probe biological processes in a deep and meaningful way, making cells understandable from an exciting whole-cell angle. The 5 core features of cytometry research include panel design, sample preparation, data analysis, and imaging mass cytometry. It’s always a good idea–for veterans and neophytes alike–to review the core principles of cytometry technology’s functionality.
To learn more about how Mass Cytometry Revolves Around These 5 Things, and to get access to all of our advanced materials including 20 training videos, presentations, workbooks, and private group membership, get on the Flow Cytometry Mastery Class wait list.

ABOUT TIM BUSHNELL, PHD
Tim Bushnell holds a PhD in Biology from the Rensselaer Polytechnic Institute. He is a co-founder of—and didactic mind behind—ExCyte, the world’s leading flow cytometry training company, which organization boasts a veritable library of in-the-lab resources on sequencing, microscopy, and related topics in the life sciences.
More Written by Tim Bushnell, PhD


