The Need For Speed In Flow Cytometry Data Analysis
Speed is a highly touted metric in flow cytometry. Look at any vendor’s website and you will see the highlights on how many events per second their instrument can acquire, how many cells can be sorted per second, and more. The limitations are imposed by the physics of flow cytometry, the speed of pulse processing, and more. With cell sorters, Poisson statistics dominate the speed calculation. As has been discussed before, the optimal sort rate is ¼ the frequency of droplet generation. Sorting faster will impact purity of the final product.
One of the trends in flow cytometry is pushing the limit of the number of parameters that can be measured at one time. The CyTOF threw the gauntlet down to start this new race by changing how the signal was detected. It didn’t take long for fluorescence-based cytometers to begin pushing past the 18-fluorochrome limit, and now instruments that can do 24 or more fluorescent parameters at the same time are available. Spectral cytometry may push this limit to 50 parameters or more in the near future.
With all these parameters, the data files become very large very quickly, and the ability to analyze such complex data becomes increasingly difficult. This has led to the desire to find analytical methods that can reduce the complexity of the data in some way to make it more manageable to find populations of interest. One of the most popular algorithms in flow cytometry circles is the tSNE algorithm. You can read more about it in these articles: van der Maaten and Hinton (2008), van der Maaten (2014), and Amir et al (2013).
tSNE allows for the visualization of high-dimensional data on a single bivariate plot. From these single plots, further analysis can be performed using other analytical techniques. However, the tSNE analysis, although powerful, is very slow and memory-intensive. In order to complete the tSNE algorithm in a reasonable amount of time, most datasets are downsampled.
Downsampling is a process where a smaller number of events is used as representative of the whole sample. This happens all time in our daily lives and generally we don’t notice it. However, if you are a true audiophile, for example, there is a difference between an electronic copy of a piece of music and hearing it from the original source.
When the data is downsampled, there is a probability that rare events will be removed from the data. Since these low frequency events are often the pieces of data the research is most interested in, the larger the sample size that can be processed, the less likely this is to occur.
This brings us back to the need for speed. The goal of our high-dimensional experiments is to identify changes in the experimental system, finding those rare events that allow for a more complete understanding of the biology. It becomes a balancing act between adding more data and keeping the overall analysis time manageable.
There are several commercially available implementations of the tSNE algorithm available on the market. The question becomes, “How fast can each of these implementations perform the tSNE analysis on a standard file, using a typical desktop computer?” In the interest of fairness, you can download the file that was used and the method for running the competition here.
The competitors in this test were: Cytobank™, FCS Express™, and FlowJo®. For those more sophisticated, and as a benchmark, the freely available R implementation of tSNE was also run.
Before the results are revealed and the winner of the first tSNE speed race is named, it is important to understand how the timing was done and the steps in each implementation. These are presented below, in alphabetical order.
Cytobank™ requires uploading the data to the cloud, where it can inform you that your data is in a queue to be processed. The timings below include both the upload and wait time (in these tests, these were under 2 minutes each, for a total of ~4 minutes). The queue waiting time is likely variable, depending on how many other people around the world have samples waiting to be analyzed by tSNE, so your mileage may vary. Cytobank™ does not require a separate downsampling step, as “desired total events” is a setting built into the viSNE (tSNE) module. Thus, the time for downsampling is automatically part of the viSNE (tSNE) calculation time itself.
FCS Express™ does not require a separate downsampling step, as “sample size” is built into the FCSE Express tSNE transformation Tool. Thus, as in Cytobank, the time for downsampling is automatically part of the tSNE calculation time itself.
FlowJo® requires installation of the DownSample plugin. To use this for tSNE analysis, the user must select the number of events to be downsampled (plotted as “sample size” in the graphs below), save the layout, wait for the downsampling to finish, and use the tSNE plugin to calculate tSNE. Downsampling time is reflected in the graph below and was ~20 seconds, regardless of the number of events. Time to save the layout was neglected.
For the tests using R, sample sizes of the original file were generated with a sample-by increment, and Rtsne (available here) was run on the sampled data. As with FlowJo, the total time (i.e., for the separate downsampling step + the time for the tSNE calculation) was graphed.
The methods and timing process are described here, along with the dataset.
Various sample sizes up to at least 300,000 were tested in all 4 software packages. Ungated plots of tSNE calculated on 100,000 events are shown in Figure 1 below. The color scaling and resolution of the FCS Express plot were changed from the default to facilitate comparison with the Cytobank plot, but this was not possible in FlowJo. Also, note that it is the nature of tSNE that results vary with each run, due to the nonlinear dimensionality reduction the algorithm performs. Don’t worry if your plots differ in appearance from those below.
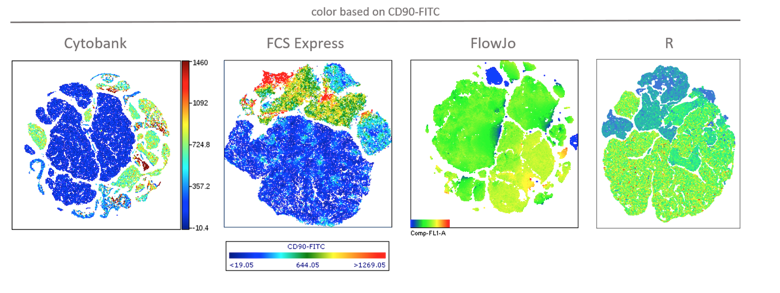
Figure 1: Results of tSNE analysis on 100,000 events in the 4 software implementations. Color is based on CD90 expression (FITC label/FL-1 in the dataset).
The meat of this friendly competition was to determine which of the packages performed the tSNE analysis the fastest. The winner was FCS Express (green), followed by R (purple) and FlowJo (red), with Cytobank (blue) coming in last (Figure. 2). At 50,000 events, Cytobank’s calculation took almost 8 times as long as FCS Express; at 300,000 events, >5x as long.
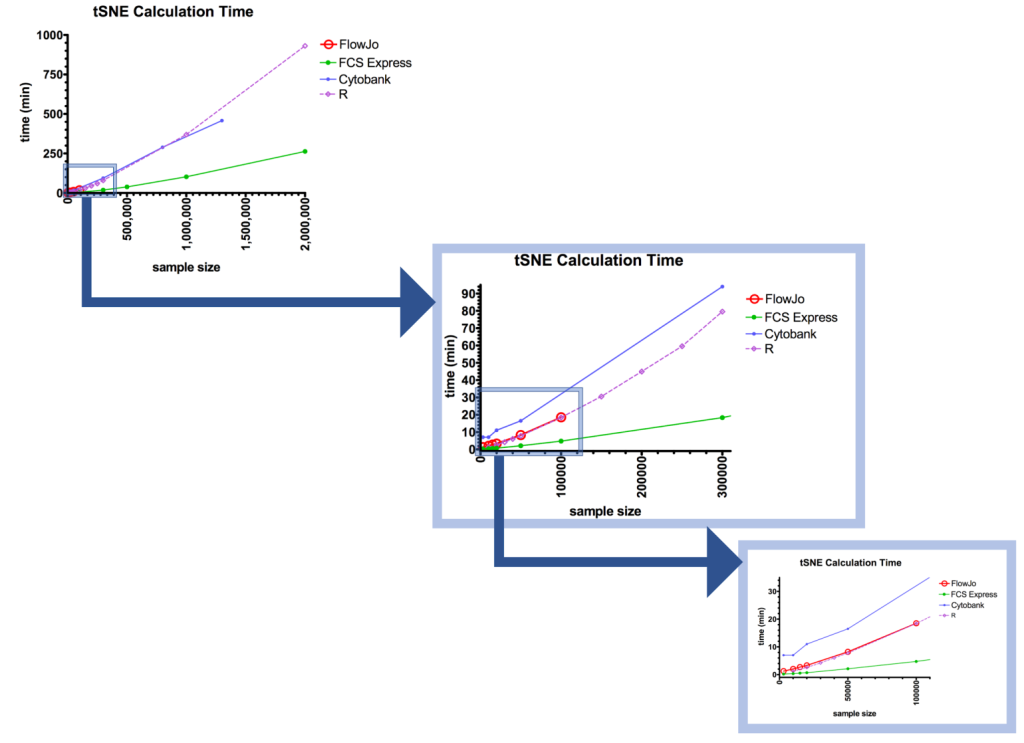
Figure 2: Results of speed test as a function of sample size.
Let’s break down the head-to-head between FCS Express™ (FCSE) and FlowJo® (FJ), 2 of the most commonly available packages for most researchers. For these packages, the tests were run in triplicate. When using a sample size of 15,000 events, the processing rates were 0.56±0.03 minutes for FCSE, versus 2.53±0.12 min for FJ. FJ is over 4 times slower than FCSE! At 100,000 events, FCSE still had a dramatic lead: 4.74±0.23 minutes versus FJ’s 17.91±0.48 minutes, nearly 4 times slower.
So, why is speed of the algorithm so important? Why worry when you can just set up the analysis and go for lunch? If you’re like me when I’m analyzing data, I like to stay in that mindset. Distractions, like a long break, can impact the train of thought about the analysis. Additionally, with long run-times, it is depressing to return to the data and see the calculation stopped prematurely because of an incorrect parameter or some other error.
More importantly, the tSNE analysis is one part of the process. To fully understand the results and identify the populations of interest requires additional work, including gating and backgating. Having tSNE analysis completed 4 times faster means that much sooner to get to this additional analysis, and that one can analyze 4 times the amount of data with FCSE when compared to FJ.
Another reason that this becomes important is for rare event analysis. To ensure that the rare event population is not lost in the downsample, it is necessary to run a large file. Further, many researchers are analyzing multiple files merged from an experiment, to ensure more accurate and consistent analysis compared to single file analysis. Surprisingly, FJ was unable to complete the tSNE calculation on sample sizes larger than 200,000 events. The other 3 packages were able to complete over a million events — FCSE completed 2 million events in 4.37 hours, and R took 15.51 hours. Cytobank (using the Premium product) was limited to 1.3 million events, and that took 7.57 hours.
In conclusion, this experiment was very illuminating. Some takeaways include that the “cloud” is not necessarily better for analysis. After uploading data to Cytobank, analysis doesn’t tie up the local computer resources, which is a plus. It can also facilitate collaborations. However, it may be less expensive to invest in a more powerful local computer and take advantage of AWS or other cloud-based data storage platforms for sharing the data. If you’re facile, go with R, the free implementation, although it’s much slower than FCSE. For my time (and we know time is money), FCSE is the winner of this speed test.
Remember, if you want to try this for yourself, the data and instructions are found here.
To learn more about The Need For Speed In Flow Cytometry Data Analysis, and to get access to all of our advanced materials including 20 training videos, presentations, workbooks, and private group membership, get on the Flow Cytometry Mastery Class wait list.

ABOUT TIM BUSHNELL, PHD
Tim Bushnell holds a PhD in Biology from the Rensselaer Polytechnic Institute. He is a co-founder of—and didactic mind behind—ExCyte, the world’s leading flow cytometry training company, which organization boasts a veritable library of in-the-lab resources on sequencing, microscopy, and related topics in the life sciences.
More Written by Tim Bushnell, PhD


