How To Determine The Optimal Antibody Concentration For Your Flow Cytometry Experiment (Part 1 of 6)

Over the next series of blog posts, we will explore the different aspects of optimizing a polychromatic flow cytometry panel. These steps range from figuring out the best voltage to use, which controls are critical for data interpretation, what quality control tools can be integrated into the assay; how to block cells, and more. This blog will focus on determining the optimal antibody concentration. 

As a reminder about the antibody structure, a schematic of an antibody is shown below. 

Figure 1: Schematic of an antibody. Figure from Wikipedia.

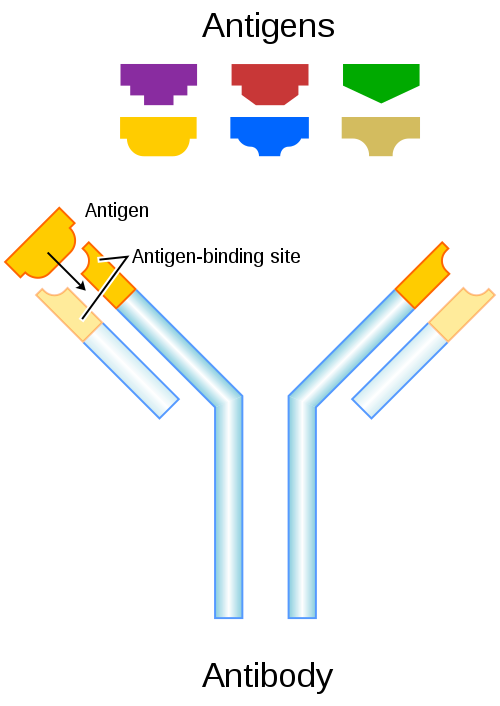
The antibody is composed of two heavy chains and two light chains that are joined together by disulfide bonds. At the top is the antigen-binding site, and at the bottom is the constant region of the antibody. When digested with a proteolytic enzyme such as papain, the antibody will separate into two Fab fragments, and the tail, or Fc fragment.

 There are three different types of binding interactions that an antibody can undergo.

The first is the antibody binding to its target antigen. This is a specific and reversible binding that obeys simple kinetics:

  ka

[R] + [L] ⇄ [RL]

  kd

The ka is the rate of formation, while the kd is the rate of dissociation. There are various tools that can be used to measure this interaction.

The second binding interaction is a specific reaction between the Fc fragment and one of several types of Fc Receptors that are expressed on certain cells. This is a specific interaction, but generally not something that we are interested in. Minimizing this interaction will be the topic of a future blog post. 

The third binding interaction is what is termed non-specific binding. This is when the Fab fragment binds to a low-affinity target. This binding is responsible for the increase in background staining of a flow cytometry experiment. 

In flow cytometry, the goal is to make the most sensitive measurement we can make. There are many things that reduce the sensitivity of our measurements including autofluorescence, spectral spillover, and increasing background. This is where titration comes into play. The goal of titration is to identify the best optimal antibody concentration that results in the highest signal to noise measurement. In this process, we will label cells over a concentration range, calculate the staining index (SI) at each point, and plot concentration vs SI.

The first question that is often asked is how many points should you use? An informal survey was conducted and the results are:

Figure 2: Percentage of responses to the question ‘How many antibody concentration do you use when performing a titration?’

There is no clear consensus in the flow cytometry community as to how many points should be done. This survey suggests ‘5 points’ is used by a large percentage of researchers.. The crucial point of the titration experiment is to ensure that you identify the optimal signal to noise and have some points around that value.

When you perform the titration experiment, make sure to follow the protocol that you would be using the antibody in. For example, if you are performing intracellular staining, make your titration reflect that. Likewise, you should consider adding a viability dye to remove any dead cells that can confound the results by increasing the cv of the data. There are two schools of thought in this matter, one suggests to use the same viability dye as the one you will use in the experiment, the other suggestsy to use a viability dye that will not impact the staining of the target (i.e. require compensation).

A typical titration curve is shown below in figure 3. 

Figure 3: Staining index versus antibody concentration.

For antibody A, the maximal separation is somewhere between 0.25 and 1 micro liters. In this case, the researchers chose 0.5 micro liters. Why? At this concentration, if there are any issues in the preparation (i.e. pipetting errors), a little less or a little more will not change the SI. However, at 0.25 micro liters if there is an issue, and less antibody is used, the SI decreases, which could impact the resolution of the data. Regarding antibody B, the concentration of 0.25 micro liters was chosen for the same reason.

Recalling the equation above about the kinetics of the reaction, we can take advantage of biochemistry to calculate the binding kinetics, assuming Michaelis-Menten kinetics of binding. In this case, we would plot the antibody volume vs median fluorescent intensity and calculate the best fit line to this data. From that, we can extrapolate the Vmax and KM values. Assuming that the saturation is at 80%, it is possible to extrapolate the antibody concentration. This data is shown below, calculated in FCS Express, with their built-in regression toolkit. 

Figure 4: Kinetics calculations for determining the amount of antibody concentration to use.

As you will recall, for antibody A, the SI suggested 0.5 micro liters, and for antibody B, 0.25 micro liters. 

Which to choose? Which is correct? Interestingly, the answer is ‘it depends.’ The purpose of the staining index is to look at the best separation between the background and positive signal, which is what is most important in the experiment. In fact, in the Cyto2015 tutorial ‘Forensic Flow Cytometry’ on slide 31, the authors state that ‘there is often at least a 4x range of concentrations that are just fine’ and they show it on the next slide to make their point. If you are interested in reading more about this topic, we recommend a recent publication by Kalina, Lundsten and Engel

At the end of the date, it is important to use optimal antibody concentration, with an eye to ensuring that there is the best separation between positives and negatives, which will help ensure the most sensitive measurement is being made in the experiment.

To learn more about important control measures for your flow cytometry lab, and to get access to all of our advanced materials including 20 training videos, presentations, workbooks, and private group membership, get on the Flow Cytometry Mastery Class wait list.

Join Expert Cytometry's Mastery Class

ABOUT TIM BUSHNELL, PHD

Tim Bushnell holds a PhD in Biology from the Rensselaer Polytechnic Institute. He is a co-founder of—and didactic mind behind—ExCyte, the world’s leading flow cytometry training company, which organization boasts a veritable library of in-the-lab resources on sequencing, microscopy, and related topics in the life sciences.

Tim Bushnell, PhD

Similar Articles

The Power Of Spectral Viewers And Their Use In Full Spectrum Flow Cytometry

The Power Of Spectral Viewers And Their Use In Full Spectrum Flow Cytometry

By: Tim Bushnell, PhD

What photon from yonder fluorochrome breaks?  It is … umm… hmmm. Let me see. Excitation off a 561 nm laser, with an emission maximum of 692 nm. I’m sure if Shakespeare was a flow cytometrist, he might have written that very scene. But the play is lost in time. However, since the protagonist had difficulty determining what fluorochrome was emitting photons, let’s consider how this could be figured out. In my opinion, one of the handiest flow cytometry tools is the spectral viewer. This tool helps visualize the excitation and emission profile of different fluorochromes, as well as allowing you…

Fickle Markers: Solutions For Antibody Binding Specificity Challenges

Fickle Markers: Solutions For Antibody Binding Specificity Challenges

By: Tim Bushnell, PhD

Reproducibility has been an ongoing, and important, concept in the sciences for years.  In the area of biomedical research, the alarm was sounded by several papers published in the early 2010’s.  Authors like Begley and Ellis, Prinz and coworkers, and Vasilevsky and colleagues, among others reported an alarming trend in the reproducibility of pre-clinical data.  These reports indicated between 50% to almost 90% of published pre-clinical data were not reproducible.  This was further highlighted in the article by Freedman and coworkers, who tried to identify and quantify the different sources of error that could be causing this crisis.  Figure 1,…

5 Common Flow Cytometry Questions, Answered

5 Common Flow Cytometry Questions, Answered

By: Tim Bushnell, PhD

I want to thank all of you who send us your questions about flow cytometry, so I thought I would dip into the old email bag and answer a few of the common ones here.  If your question isn’t answered this time, look for it to be answered in a future blog post.  Of course, if you want us to cover a specific topic, drop us a line.  1. How Fast Can I Go? This is  a common question. The allure of the ‘hi’ button is hard to resist.  The faster you go, the sooner you are finished with data…

Combining Flow Cytometry With Plant Science, Microorganisms, And The Environment

Combining Flow Cytometry With Plant Science, Microorganisms, And The Environment

By: Tim Bushnell, PhD

My first introduction to flow cytometry was talking to a professor who’d brought one on a research cruise to study phytoplankton. It was only later that I was introduced to the marvelous world that’s been my career for over 20 years.   In that time, I’ve had the opportunity to work with researchers in many different areas, exposing me to a wide variety of cell types and more important assays. What continues to amaze me is the number of different parameters we can measure, not just the number of fluorochromes, but the information we can extract from samples – animal, vegetable…

Common Numbers-Based Questions I Get As A Flow Cytometry Core Manager And How To Answer Them

Common Numbers-Based Questions I Get As A Flow Cytometry Core Manager And How To Answer Them

By: Tim Bushnell, PhD

Numbers are all around us.  My personal favorite is ≅1.618 aka ɸ aka ‘the golden ratio’.  It’s found throughout history, where it has influenced architects and artists. We see it in nature, in plants, and it is used in movies to frame shots. It can be approximated by the Fibonacci sequence (another math favorite of mine). However, I have not worked out how to apply this to flow cytometry.  That doesn’t mean numbers aren’t important in flow cytometry. They are central to everything we do, and in this blog, I’m going to flit around numbers-based questions that I have received…

3 Must-Have High-Dimensional Flow Cytometry Controls

3 Must-Have High-Dimensional Flow Cytometry Controls

By: Tim Bushnell, PhD

Developments such as the recent upgrade to the Cytobank analysis platform and the creation of new packages such as Immunocluster are reducing the computational expertise needed to work with high-dimensional flow cytometry datasets. Whether you are a researcher in academia, industry, or government, you may want to take advantage of the reduced barrier to entry to apply high-dimensional flow cytometry in your work. However, you’ll need the right experimental design to access the new transformative insights available through these approaches and avoid wasting the considerable time and money required for performing them. As with all experiments, a good design begins…

The Fluorochrome Less Excited: How To Build A Flow Cytometry Antibody Panel

The Fluorochrome Less Excited: How To Build A Flow Cytometry Antibody Panel

By: Tim Bushnell, PhD

Fluorochrome, antibodies and detectors are important. The journey of a thousand cells starts with a good fluorescent panel. The polychromatic panel is the combination of antibodies and fluorochromes. These will be used during the experiment to answer the biological question of interest. When you only need a few targets, the creation of the panel is relatively straightforward. It’s only when you start to get into more complex panels with multiple fluorochromes that overlap in excitation and emission gets more interesting.  FLUOROCHROMES Both full spectrum and traditional fluorescent flow cytometry rely on measuring the emission of the fluorochromes that are attached…

Flow Cytometry Year in Review: Key Changes To Know

Flow Cytometry Year in Review: Key Changes To Know

By: Meerambika Mishra

Here we are, at the end of an eventful year 2021. But with the promise of a new year 2022 to come. It has been a long year, filled with ups and downs. It is always good to reflect on the past year as we move to the future.  In Memoriam Sir Isaac Newton wrote “If I have seen further, it is by standing upon the shoulders of giants.” In the past year, we have lost some giants of our field including Zbigniew Darzynkiwicz, who contributed much in the areas of cell cycle analysis and apoptosis. Howard Shapiro, known for…

What Star Trek Taught Me About Flow Cytometry

What Star Trek Taught Me About Flow Cytometry

By: Tim Bushnell, PhD

It is no secret that I am a very big fan of the Star Trek franchise. There are many good episodes and lessons explored in the 813+ episodes, 12 movies (and counting). Don’t worry, this blog is not going to review all 813, or even 5 of them. Instead, some of the lessons I have taken away from the show that have applicability to science and flow cytometry.  “Darmok and Jalad at Tanagra.”  (ST:TNG season 5, episode 2) This is probably one of my favorite episodes, which involves Picard and an alien trying to establish a common ground and learn…

Top Industry Career eBooks

Get the Advanced Microscopy eBook

Get the Advanced Microscopy eBook

Heather Brown-Harding, PhD

Learn the best practices and advanced techniques across the diverse fields of microscopy, including instrumentation, experimental setup, image analysis, figure preparation, and more.

Get The Free Modern Flow Cytometry eBook

Get The Free Modern Flow Cytometry eBook

Tim Bushnell, PhD

Learn the best practices of flow cytometry experimentation, data analysis, figure preparation, antibody panel design, instrumentation and more.

Get The Free 4-10 Compensation eBook

Get The Free 4-10 Compensation eBook

Tim Bushnell, PhD

Advanced 4-10 Color Compensation, Learn strategies for designing advanced antibody compensation panels and how to use your compensation matrix to analyze your experimental data.