3 Compensation Mistakes That Will Ruin Your Flow Cytometry Experiments

Putting it basically, compensation is the mathematical process of correcting spectral spillover from a fluorochrome into a secondary detector. Yet even the most talented rookie researchers may find themselves at a loss when it comes to this topic. This is one of the most important parts of the experiment to get correct, and yet there remain rumors and myths that circulate among users that will prevent you from getting correct compensation.
Good compensation requires that you tightly adhere to certain rules, understand the function of your instrument, and keep in mind how fluorescence occurs. Compensating poorly leads to false conclusions, and you certainly don’t want that.
Even among us flow cytometry veterans, a strong foundation is occasionally in need of a tune-up. And in a topic as dense as flow cytometry, it’s important that we refresh ourselves on some of the fundamentals once in a while. In fact, it is the longtime cytometry expert who must check themselves for any sort of faith in faulty old practices. Science is ever a work in progress, and traditional methods are not always the right methods.
Today’s blog will review 3 incorrect concepts that continue to circulate around this important process and why you want to avoid them.
Compensation Principles, Redux
To start, let’s quickly cover a few ground rules for good compensation. As you perform your own experiments, remember these founding principles:
- Your control must be (at least) as bright as your sample.
- The backgrounds of the positive and negative carriers must be matched.
- Compensation color must precisely match experimental color
Compensation ultimately is the calculation of the slope of the line between a single stained positive and an unstained negative. If the particles are too dim, the resulting slope value will fall well below where it ought to be. Thus, the control has to match the sample’s brightness. Make sure the controls are bright and treated the same way. Remember also that signals need to be on-scale and within the linear region of the PMT detector. When a signal violates either of these conditions, accurate compensation becomes impossible.
Additionally, to properly calculate slope, the positive and negative backgrounds must be the same – otherwise, you’re lacking a control setting for accurate comparison. Finally, compensation color has to exactly match the experimental color. You’ll want a matched fluorochrome, matched sensitivity, and matched treatment. Otherwise, you’re dealing with different spectra, and you won’t be able to substitute one for the other.
3 Mistakes That Negatively Impact Flow Cytometry Experiments
Now that we’ve covered some proper methodology, let’s get to the 3 faulty methods that will bring confusion and inaccuracy to any flow cytometry experiment. Avoid the following practices at all costs.
1. Incorrectly employing a universal negative
The “universal negative” refers to a process in which a single tube, consisting of unstained cells, sets the negative population for establishing the compensation matrix. If you only have beads, or you only have cells, then a universal negative can be used without issue. As an example, if you were to use beads as a positive control in your experiment, the correct comparison would be unstained beads. However, if you have a mixture of beads and cells, then you must avoid a universal negative. What you don’t want is to use cells as a negative control with beads as your positive control. Figure 1 shows the impact of mismatched controls.

Figure 1: Unstained cells (green) and unstained beads (purple) are matched with positively stained beads. The lines connect the positive bead median with the medians of the negative populations.
If you want accurate results, positive and negative carriers must have the same background. For example, if you had beads for the antibodies and cells for, say, DAPI or GFP, you’d need a positive sample and a negative sample for each control. In fact, the best practice is to have a positive and a negative sample in each of your compensation controls. This ensures that samples are treated identically through the staining process.
2. Preventing compensation values from exceeding a certain percentage.
You might have heard a rumor that compensation ought to be no greater than a set amount. Specifically, you might have heard it said that this amount is around the 40-50% range. But remember that compensation consists of a mathematical correction that is based on appropriate controls. What can follow from this faulty line of thinking is the impression that compensation values need to be reduced – in other words, that the voltage ought to be adjusted. This is a waste of effort. Changing the voltage will impact the compensation value, but it has no effect on your data spread., as shown in Figure 2.

Figure 2: Spreading error is independent of compensation value. PE and PE-Cy5 were collected over a range of voltages for the PE-Cy5 detector while holding the PE detector voltage constant. Compensation values for each voltage were calculated in FlowJo yielding values ranging from 2.7% up to 2,900%. Importantly, the spread of the PE-Cy5 beads in the PE channel as indicated by the dashed line is unchanged. This data shows that a high compensation value is not indicative of severe spillover spreading. Data courtesy of the University of Wisconsin Carbone Cancer Center Flow Cytometry Lab.
Any spreading error is independent of your compensation value, so you may rest assured that a high compensation percentage does not indicate any sort of severe spillover issue. As far as voltage adjustment, what you should actually aim for is voltration. This is the optimization of voltage achieved using a “voltage walk.” Importantly, this process needs to occur during panel optimization. During voltration, correctly titered antibodies will stain cells, and these get run at increasing voltages. Then the Staining Index is calculated and the optimal point of antibody separation can be identified.
3. Reusing a compensation matrix
Not every experiment goes according to plan. Sometimes, an experiment is skewed by some error or another. You might be able to salvage these experiments, but what if the controls are lost? Sometimes, the experimenter decides to be “efficient” by reusing the matrix from a previous experiment. For some reason, this is an idea that researchers continue to bring to the table – but it’s not a good idea.
In order for compensation to be accurate, the setting and fluorochrome must be identical. By using a matrix from a previous experiment, you are violating that critical staple of the calculation process. What if a previous experiment ran a dye that sticks? Or what if the instrument had a major realignment or repair conducted? These issues could compromise your data.
With the relatively low cost of capture beads and the fact that you don’t need to use the same concentration of antibody as on your samples, there is no excuse to reuse a matrix in an attempt to save a few minutes on this essential control. Figure 3 shows how a compensation matrix acquired one week apart change. The instrument was under tight control, and the voltages based on application-specific settings, coupled with using peak 6 beads to check voltage.
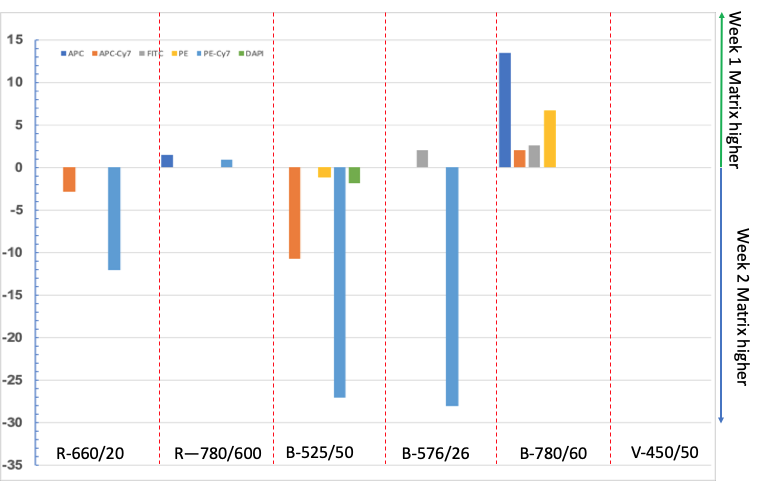
Figure 3: Beads were stained with antibodies and acquired on a FACSCanto-II. The compensation matrix was calculated in Flowjo. The percentage difference between week 1 and week 2 was calculated. As can be seen, there are significant differences between the matrices.
In conclusion, poor or incorrect compensation is naturally deleterious to the reliability of your data. So as you go about your experiments in the future, you can facilitate high-quality compensation by following the ground rules outlined and avoiding these 3 major errors that researchers sometimes make: incorrectly employing a universal negative, preventing compensation values from exceeding a certain value, or reusing a compensation matrix.
As a final note, if there are issues with your data, avoid the temptation to manually adjust the compensation matrix – especially to make the data “look right.” Instead, figure out what is causing compensation problems by reviewing the data in the context of this guide. And in general, make sure that a standard reference control is always run in the panel. This allows you to evaluate the whole staining process, and it helps the troubleshooting process when compensation seems problematic.
To learn more about compensation mistakes and get access to all of our advanced materials including 20 training videos, presentations, workbooks, and private group membership, get on the Flow Cytometry Mastery Class wait list.


